about the financial independence calculator.
Financial Independence is the idea that once you have saved a certain amount of income your savings will finally make enough interest that it will be equal to your expenses. Simply put, it is the day that your money starts working for you rather than you working for money.I have been interested in the idea of financial independence ever since I could figure out how to use the future value formula in Excel. But how, do you go about finding the amount of time you need to work and save before you don't need to work and save?
back to calculator.a problem.
and a bit of research.
Find an equation for financial independence and create an interactive general application in 24 hours.
It's not like I have been the only person to think about financial independence. Blogs such as Mr. Money Moustache talk without end about the goals of financial independence and early retirement. Reading over his blog post, he links to Networthify's retirement calculator. This was exactly what I was looking for. But there were flaws; their equation wasn't general enough and ultimately wrong.
an equation.
WARNING! JARGON AND A LOT OF MATH AHEAD!
Networthify states that the equation for finding your financial independence date is
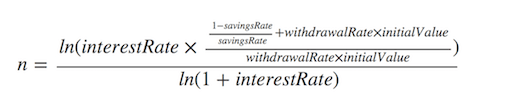
However, although their assumptions are correct they do not use general formulas for capital accumulation or future value of a series, and ultimately do not come to a general enough equation for my liking.
Here is my walkthrough of getting to financial independence (sorry this is the math-y part):
Ec = Current Expenses
Ef = Future Expenses
Ec = Ef
W = Withdraw Rate
Vf = Future Value
Va = Future Value A
Vb = Future Value B
Vf = Va + Vb
Vi = Initial Value
r = Interest Rate
t = Compounding Period
n = Time Until Retirement
Va = Vi * (1+r/t)^(t*n)
S = Annual Savings
Vb = S/t * ((1+r)^(t*n)-1)/(r/t)
A = Annual Income
R = Savings Rate
S = A*R
Ec = Ef
Ec = W*Vf
Ec = W*(Va+Vb)
Ec = W*((Vi*(1+r/t)^(t*n))+((S/t)*(((1+r/t)^(t*n)-1)/(r/t)))
A-S = W*((Vi*(1+r/t)^(t*n))+((S/t)*(((1+r/t)^(t*n)-1)/(r/t)))
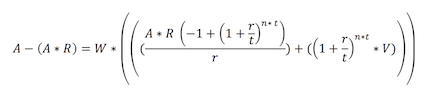
A-(A*R) = W*((Vi*(1+r/t)^(t*n))+(((A*r)/t)*(((1+r/t)^(t*n)-1)/(r/t)))
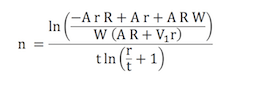
Leading us to this beauty of an equation:
Thanks to Wolfram Alpha we don't need to do difficult logarithms and rearranging to solve for n and BAM the equation to financial independence appears
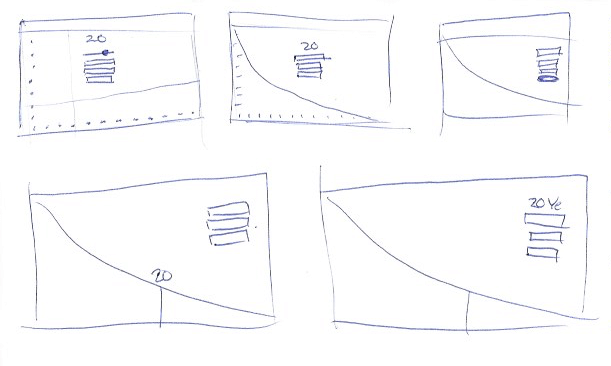
a design.
and a codebase.
Woo. That was a lot of math and not much design work. However, we now have the foundation to build that application. I like the interactions that Networthify adds to their calculator but all I really want to know is how many years I need to save to get to financial independence. Seeing as the equation is so complicated and the topic is so overwhelming for some people, creating a simple, helpful, and understandable calculator should be the goal.
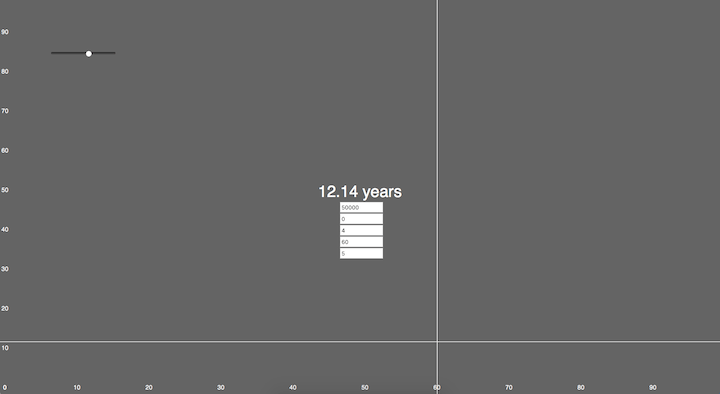
After laying out a strong foundation it was time to hit the books and read up on Google Charts. It would be the core Api that would help reflect the data visually. Easy enough to implement, fast, and reliable.
Here is the code for the calculator if you would like to eye it over.
 google.charts.load('current', {'packages':['corechart']});
google.charts.setOnLoadCallback(drawChart);
    var annualIncome;
    var savingsRatel
    var interestRatel
    var withdrawalRate = 0.04;
    var initialValue;
    var compoundingPeriod = 365;
function drawChart() {
    annualIncome = $('#annualIncomeid').val();
    savingsRate = ($('#annualIncomeid').val() - $('#annualSpendingid').val()) / $('#annualIncomeid').val();
    interestRate = $('#averageInterestRateid').val()/100;
    // withdrawalRate = $('#withdrawalRateid').val()/100;
    initialValue = $('#currentValueid').val();
    if($('#annualSavingsid').val() > $('#annualIncomeid').val()){savingsRate = 0;}
    var chartData = google.visualization.arrayToDataTable(getData());
    var options = {
        chartArea: { width: '100%', height: '100%' },
        curveType: 'function',
        legend: { position: 'none' },
        hAxis:{
            textPosition: 'none',
            baselineColor: 'none',
            viewWindow:{
                min:0.01,
                max:1
            },
            format: '#,###%',
            gridlines:{
                color: 'none'
            },
        },
        vAxis:{
            // textPosition: 'none',
            textStyle: {
                color: '#C6C6C6'
            },
            viewWindow:{
                min:0,
                max:100
            },
            baselineColor: 'none',
            gridlines:{
                color: 'none'
            }
        },
        tooltip:{
            trigger:'none'
        },
        colors:['#1EAEDB','#e1e1e1'],
        animation: {
            duration: 2000,
            easing: 'out',
            startup: true,
            },
    };
    var chart = new google.visualization.AreaChart(document.getElementById('chart'));
    chart.draw(chartData, options);
}
function getFi(R){
    var fi = Math.log(( -annualIncome * interestRate * R + annualIncome * interestRate + annualIncome * R * withdrawalRate ) / ( withdrawalRate * (annualIncome * R + initialValue * interestRate)))/(compoundingPeriod * Math.log( interestRate / compoundingPeriod + 1 ));
    return fi;
}
function getData(){
    var data = [
        ['savings rate','years until financial independence','rest'],
    ];
    if(annualIncome > 1000){
            var years;
        for(var i = 0; i < savingsRate; i+=0.001){
            years = getFi(i);
            var d = [ i , years, null];
            data.push(d);
        }
        if(!isNaN(years) && years > 0){
            $('#years').text(Math.ceil(years) + " years");
        }else{
            $('#years').text("Never");
        }
        for(var i = savingsRate; i < 0.99;i+=0.001){
            years = getFi(i);
            var d = [ i , null, years];
            data.push(d);
        }
    }
    return data;
}
$(function(){
        $('form').keyup(function(e){
        var code = (e.keyCode || e.which);|
        if( code == 17 || code == 65 || code == 91 || code == 9 || code == 37 ||  code == 39 ) {
            return;
        }else{
            drawChart();
        }
        });
});
a final product.
thanks for reading.
I am very pleased with the way the project turned out and I hope that you might have appreciated it too. Thanks for reading this post.